Early measurement of HRV
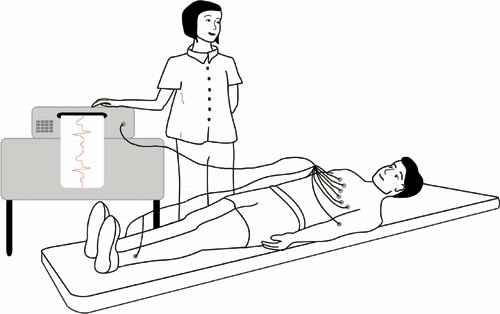
Although irregular heart rhythms and their potential for predicting health outcomes had been noticed by Chinese medics all the way back to 400 AD, it really took the Nobel prize winning invention of the Electro Cardio Graph (ECG or EKG) by William Einthoven in 1901 to bring sufficient precision to start making calculations. The basic methods of the ECG and even the naming of the features have not fundamentally changed over the years. The heart, like any muscle, produces an electrical signal when it contracts – the bigger the muscle the bigger the signal, and this can be detected by electrodes placed on the skin either side of the muscle. Einthoven’s invention required the patient to place their hands & feet in buckets of salt water, but it wasn’t long before dedicated electrode patches were designed that could be attached to the skin covering the chest. The salt water legacy remains, though, in the form of ECG gel which is designed to improve the electrical contact with the skin.

Early ECG machines used an ink pen that moved according to the size of the signal on squared paper which rolled past at a constant speed, so measuring the number of squares between recognisable features allowed timings to be calculated. The sharpest spike is called the R wave, and counting the number of squares between R waves allows the R-R interval to be calculated. HRV is the method of analysis that looks at how a person’s R-R intervals change over time. In the example below, it is easy to see that the R-R interval increases during expiration and decreases during inspiration. This is caused by the action of the vagus (parasympathetic) nerve on the heart, and is one of the key phenomena of HRV. When the action of the vagus nerve is blocked in experiments, this variation disappears almost completely, and is not caused, as some people think, by pressure changes inside the chest.

The first HRV calculations were performed by hand after measuring a series of R-R interval timings, and were therefore called ‘time domain’ measurements. Later on, as electronics & computers progressed, it became possible to recognise R waves (and other ECG features) automatically, and also to do more sophisticated calculations including statistical, frequency domain and entropy (or chaos) type measures. Time domain measures are still very often used in practice, as they are relatively simple to do, and their correlations with the underlying physiology have been well established.
Accessible measurement of HRV
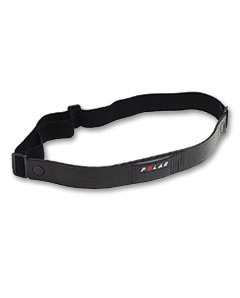
The requirement for an ECG kept HRV in the clinic & lab for many years until Polar invented the heart rate monitor in the early 1980s. This was a breakthrough because its attachment & wireless transmission enabled the user to perform exercise with it on. In essence though, it is still an ECG, with built in R wave detection & a radio transmitter. The parts that contact the skin are conductive and relay the tiny signals to the electronics in the centre module for amplification & transmission. Despite advances in digital processing and transmission standards such as ANT+ and Bluetooth, all HRM chest transmitters still work this way.

Polar also produced software to allow HRV analysis from its HRMs, and although some researchers do use this, an independent comprehensive software called Kubios is often used in research as it is well trusted and provides many different analysis options. It also includes the ability to exclude artifacts (ie noise) or ectopic (eg premature) beats which would otherwise distort the HRV calculation.
The importance of precision
Precision of calculation is important and depends on the accuracy by which the exact timing of the R wave peak can be detected. Whilst ECGs were digitised at a rate of 128 samples per second for many years, leading to an accuracy of 8 ms (milliseconds or thousandths of a second), more modern ECGs digitise at 500 or 1000 samples per second, giving a precision of 1-2 ms, which is considered fully adequate. Modern HRM chest straps are also capable of reaching this level of precision although they do have to be designed with this requirement in mind, because it is not needed for regular heart rate measurements, which tend to average over 5-7 beats, thereby eliminating the HRV in favour of a nice steady number on the wristwatch display. There are also apps that measure average heart rate using a smartphone camera, but this samples at a maximum rate of 30 samples (or frames) per second, leading to a precision of only 33 ms, which is much too low for true HRV.
The future of HRV measurement?
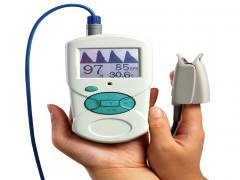
Not to throw out this principle though, every time the heart beats, it sends a pulse of blood rushing through all the arteries of the body, which fills the capillaries and causes them to bulge slightly. This effect can de detected because the amount of light absorbed increases also at that time. This is the principle used by the pulse oximeter, also a clinical tool used for diagnosis.

The pulse is usually measured at either the finger tip, toe, earlobe or forehead, but in each case the principle is the same – the pulse waveform peaks can be treated like R waves, and the distance between them measured. There has recently been more research interest in HRV derived from pulse waveforms, as the sensor is potentially much more convenient than having to put on a chest strap. Good correlations have been established between pulse and ECG derived HRV, usually with a positive bias for HRV derived from pulse waveforms ie the HRV you measure is a little higher, but consistently so. Very recent research has looked at ways of reducing this bias so that pulse measured HRV can be a direct substitute for ECG derived HRV.
As technology continues to develop it is clear HRV monitoring is going to become more convenient and widely available!
References
Heart rate variability – a historical perspective. George E. Billman
Heart rate variability; Standards of measurement, physiological interpretation, and Clinical use. Task Force of The European Society of Cardiology & The North American Society of Pacing and Electrophysiology. European Heart Journal (1996)
Interchangeability between heart rate and photoplethysmography variabilities during sympathetic stimulations. K Charlot, J Cornolo, J V Brugniaux, J P Richalet and A Pichon


Thank you for this explanation of seemingly complex principles which is really helpful to explain in layman’s terms enough for us to understand how and why Hrv measurement is the key to enhanced performance! I can certainly recommend ithlete and also the Bluetooth heart rate strap!
Hello Simon and thank you for the interesting analysis. A question about the inspiration & expiration, does changing your rate of inhalation change the HRV results? If this is true then what about a fatigued respiratory system…meaning could I have a fatigued respiratory system yet all other systems i.e. cardiac, muscular, etc. are not fatigued; would this affect the readout for the HRV? Along the same lines, if I fatigued my cardiac system the day before, which would affect the plasma level therefore the heart rate I achieved in the race/workout/game the day before would be lower at the same pace/intensity…would this change my HRV results? Looking forward to your response.
Hello Brian. Sorry for the delayed response – lots going on for us right now!
Rate of respiration has been shown in research to have an effect on HRV. Basically a slower rate increases parasympathetic HRV up to a point, and I considered this research carefully before selecting the paced breathing rate for ithlete. What you say about variations in breathing rate is one of the many reasons I chose paced rather than free breathing. See also our recent research blog article on this subject at http://myithlete.com/blog/?p=2251#.UouDc5TfyPc
A decrease in blood plasma volume increases the efficiency of oxygen transportation by increasing hematocrit, and occurs at the onset of exercise and when first ascending to altitude. In these cases HRV decreases, but primarily due to significant parasympathetic withdrawal. This is accompanied by increased sympathetic activation, indicating that the body is in a ‘fight-flight’ mode, so HRV would be lower, and for good reason!
Mr. Wegerif, congratulations on your very informative website. I have a question.
What would you say is the ideal time of day to measure HRV? Is it prior to an exercise session or following a workout? Also, how frequently should you measure, daily? weekly?
Dear Guy,
Thank you very much for the compliments on the website.
If the purpose of measuring HRV is either for deciding what kind of athletic training to perform that day, or for longitudinal monitoring of wellness, we recommend measuring in a seated position first thing in the morning, before breakfast to avoid confounding factors. With regard to frequency, daily is ideal, though for more highly trained individuals (who show lower CV% in their HRV readings), then 3-4 readings per week should be sufficient (Andrew Flatt at University of Alabama has researched this aspect).
Hope this is helpful, kind regards.