The ithlete Pro Training Guide – What is it for?
If you have used heart rate variability (HRV) for a while, you will be familiar with the idea that everyone has his or her own HRV baseline, and that individual readings are compared to this. The baseline is calculated as a moving average of your daily morning readings.
If your morning reading is bang on the baseline, then you are at your usual level of recovery, so the recommendation would be for you to follow your training plan. Similarly, if your morning HRV is significantly away from your baseline, then something unusual is going on and you may need to modify your plans. The significance of the change is shown via colour coding: amber for a moderate change and red for a large change (1). We can also improve the confidence of recommendations by taking the resting heart rate (RHR) into account.
Although some app users are happy with a simple red-amber-green traffic light based on HRV, there is a lot more insight that can be gained into individual adaptation by looking at the changes in both HRV and RR interval at the same time. We took an in depth look at this here, focusing on research from Plews et al. 2013.
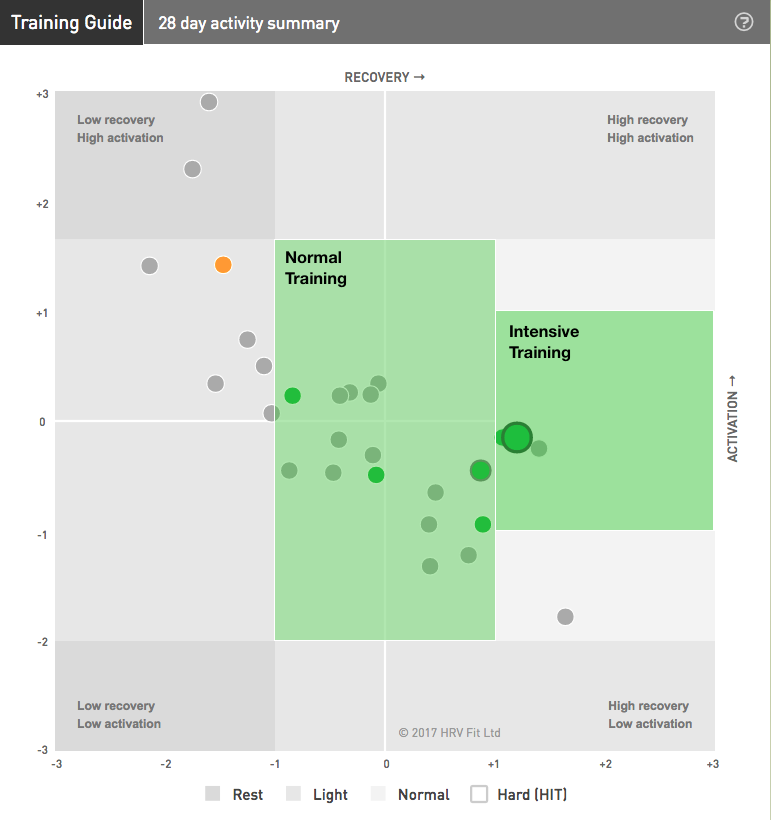
To make this information intuitively actionable we introduced the Training Guide to ithlete Pro.
How did it come about?
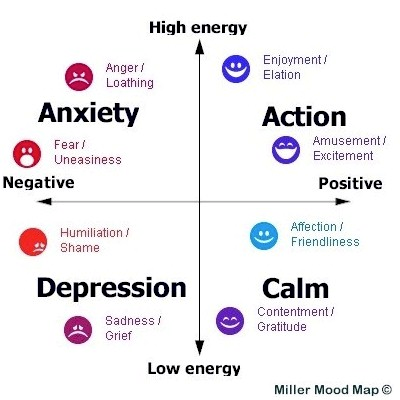
One of ithlete’s early research collaborators was former neurosurgeon and inventor of the Mood Map, Dr Liz Miller. During discussions with Liz, we identified parallels between the two branches of the autonomic nervous system – parasympathetic and sympathetic and the two dimensions of affect and arousal used to depict a range of mood states in the Mood Map (2). This encouraged me to look for a standardised way of placing HRV and HR readings on the same kind of chart, by putting HRV on the x-axis and RHR on the y-axis (3).

A good way of standardizing measurements on people whose averages (baselines) and standard deviations are significantly different is called z-scoring. A relatively simple, but powerful technique, this transforms the data into a number of standard deviations from the mean. So a measurement at the mean gets a z-score of zero, whereas a measurement that is one standard deviation above the mean gets a score of +1. For normally distributed data, 99.5% of all measurements fit within the range of -3 to +3.
Practical examples
1. Normal zone
HRV and resting HR both close to their average (baseline) values. Training and other daily activities proceed as normal.
2. Good recovery and activation
A combination of above normal HRV and resting HR can indicate the potential for good performance and high energy levels in training or competition.

3. Recovery impaired
HRV significantly below baseline and resting HR close to baseline gives an amber warning. You don’t have to stop training, but you are accumulating a recovery debt that cannot be sustained for more than a few days.

4. Low activation
Readings with a combination of higher than normal HRV combined with significantly lower than normal HR signals excessive parasympathetic dominance. You are likely to feel tired and not able to raise your heart rate, pace or power during training. You can find more about research on this area here: Can your HRV be too high?
5. Stress or illness
A combination of reduced HRV and significantly elevated resting HR is a sure sign that the body is stressed. The cause can be acute anxiety or illness. The only time you might choose to ignore this is on the morning of a competition where it can indicate race / competition day nerves. In that case try to relax as you are using up valuable energy!
Adaptation

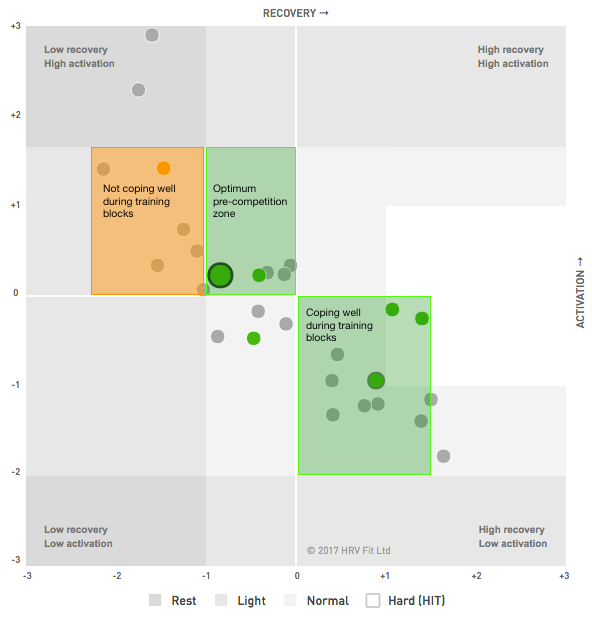
Studies on elite endurance athletes have shown particular relationships between HRV, resting HR and successful adaptation during training (4). Basically, a small to moderate increase in HRV combined with a similar decrease in resting HR indicates that your body is coping well with training, and is not finding the stress excessive. During taper, however, you should expect HRV to decrease a little below normal baseline, and resting HR to increase moderately. This does not mean you are losing fitness, but instead shows that the body is well primed for action. Readings in this zone a few days before your event are likely to lead to good competition performance – which is what it is all about!
Try the ithlete Pro Training Guide today!
Take out a 2 week free trial of ithlete Pro to see the Training Guide in practice and watch your training efficiency improve.
References
- Making meaningful inferences about magnitudes. Batterham and Hopkins (2006), International Journal of Sports Physiology and Performance
- Mood Mapping: Plot your way to emotional health and happiness, Dr Liz Miller
- Quantifying Effects of Pharmacological Blockers of Cardiac Autonomous Control Using Variability Parameters. Miyabara et al., 2017. Frontiers in Physiology
- Cardiac Parasympathetic Activity and Race Performance: An Elite Triathlete Case Study. Jamie Stanley et al, International Journal of Sports Physiology and Performance Volume 10 Issue 4, May 2015

The majoirty of my readings tend to fall in the grey area below and to the right of the two green areas. What might this signify? Top left green has 5, bottom right green has 3 and bottom left 9
Hi Chris. Do you mean the overall bottom right of the guide? If so, this is the high HRV / low activation zone. It either means you are calm, or if close to the bottom right corner, likely to be tired. This article might also be of interest, as it describes high HRV parasympathetic overreaching:
https://www.myithlete.com/can-your-hrv-number-be-too-high-heres-the-research/
Hi there, My seated heart rate is generally 37-40bpm when sitting when I take it before breakfast in the mornings. Do I need to take it while standing which makes it around 40-45bpm? and does my heart rate need to be over a certain level for it to be more accurate? ie. should I take it while walking?
Hi Dan
Good questions. The short answer is that very low resting HR values can saturate HRV so you don’t see much variation day to day (do you see this now?). We would therefore recommend standing, but bear in mind that your HRV scores will be lower (few ambers) and that the baseline will take a few days to adjust.
HRV during exercise is a different matter – it reduces progressively with intensity to first lactate threshold, where it is close to zero.
See also this new post:
https://www.myithlete.com/what-position-to-take-your-hrv-lying-down-or-standing/