 A very good recent article in the Guardian newspaper on marginal gains (a term popularized by Team Sky cycling boss David Brailsford) prompted me to write about how we see what we do at HRV Fit contributing to the rise of data analytics in sport.
We attended a sports performance and technology summit in Manchester late last year, and many coaches and performance managers spoke about the need to gather as much data as possible in order to find the magic formula that will enable a large number of very small improvements to make a BIG difference overall. That is what winning will be about in future: slightly higher speeds, slightly faster human recovery and better predictability of performance.
The technology exists now and Formula 1 is a prime example of a sport already driven by a myriad of sensors – both in the car and on the driver, that already depends on the aggregation of marginal gains to deliver 100ths of a second faster laps.
The challenge is not what to measure – we can measure anything we can think of, and often very cheaply using technology developed for high volume consumer markets. The challenge is to discover patterns in the data that will lead to winning insights. We rely on computers to crunch the numbers (a job that they perform admirably!) but human beings are still much better at proposing hypotheses (I wonder if…?) and the human visual eye-brain system is a fabulous analytic engine that can identify possible cause and effect relationships better than machine learning algorithms. The informatics algorithms can then confirm or refute our observations by putting them to the test over massive data sets and in multiple different situations to see if they hold true.
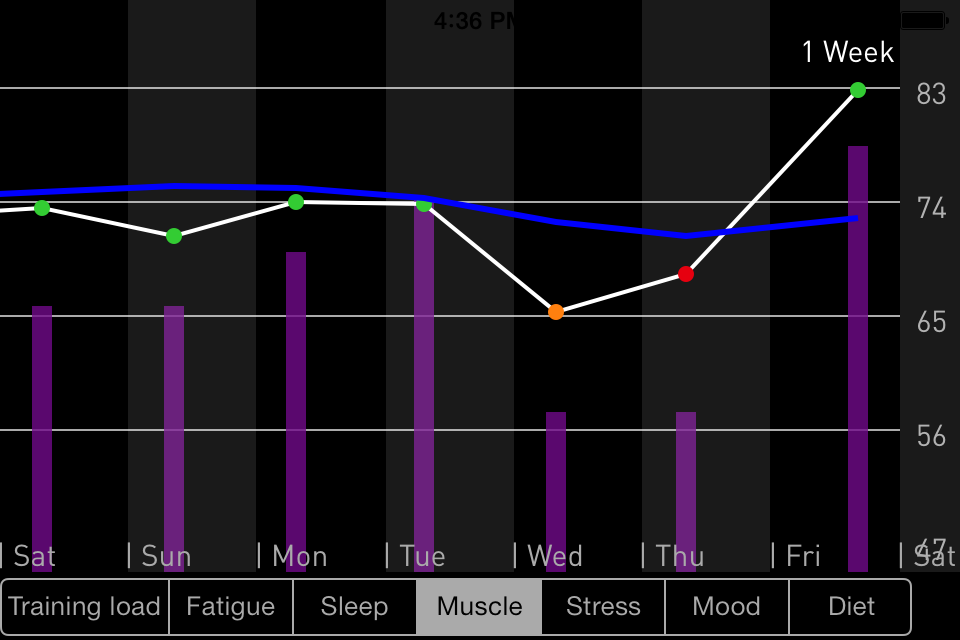
 Since version 3.0 of the ithlete HRV app, we have enabled users to record subjective data about important enablers of their recovery and overall health as well as quantified measures of their training. The landscape chart of the mobile app enabled users to look at one variable at a time to discern whether there may be a relation between for example their sleep or diet quality, and their readiness to train, and perform as measured by HRV.
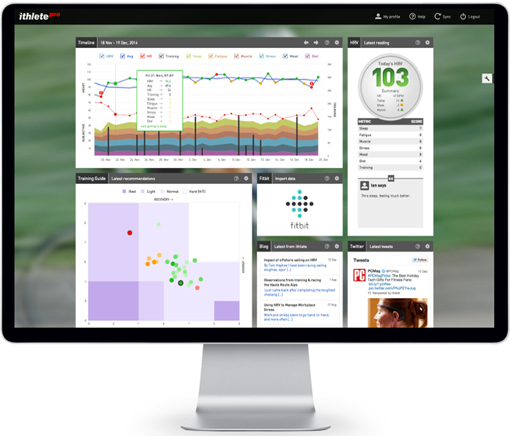
 The ithlete Team and ithlete Pro web apps go further by giving users better quality and more varied charts and tables to let their highly evolved human visual systems detect patterns that they can apply. These tools can be used on desktop, laptop or tablet devices to allow maximum flexibility in how & when they are used.
In the 5 years I have now been doing daily HRV readings, I have often thought of it as a journey of self discovery – learning things about myself I didn’t know (or only vaguely suspected) before. I’ve seen marginal gains in my own performance despite advancing age, and my average HRV is now 10 pts higher than it was at the start.
Ultimately it’s about individuality – we are all different and affordable tools like ithlete can help us get the most out of ourselves, and at the end of the day, isn’t that what its all about?

Very good article. Brilliant that is “right on” where it maters. Written by Simon Wegerif ? Whomever wrote it why not sign it?
Good point! It was indeed Simon, we’ll be sure to add this to future posts.
Thank you for the feedback,
Laura